Use ← and → to navigate
Swipe left / right on mobile
Guide Notes & Explanation
Accompanying breakdown for this slide deck
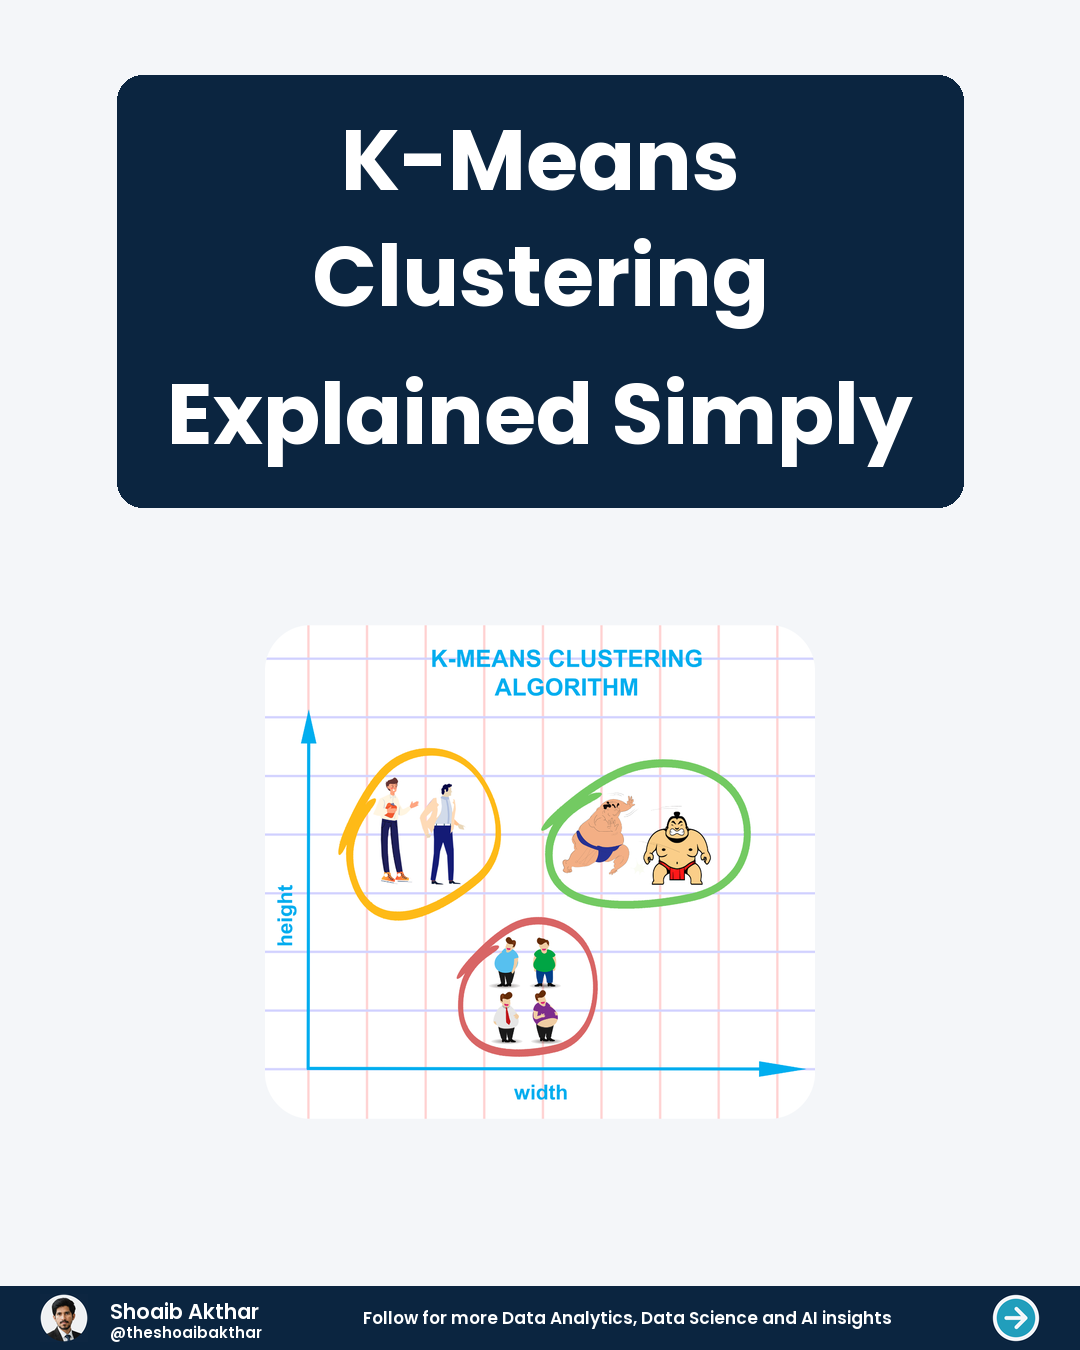
- K-Means Clustering Explained Simply
What is Clustering?
- Clustering is an unsupervised machine learning technique. Its goal is to group similar data points together. It helps discover hidden patterns in data without prior labels.
- Think of it as organizing a messy closet. You group shirts, pants, and socks together based on their type. K-Means is a popular algorithm that performs this task automatically.
- It is widely used for customer segmentation, image compression, and document classification. By finding natural groupings, it provides valuable insights from raw data.
The Core Idea
- K-Means aims to partition data into K distinct clusters. Each data point belongs to the cluster with the nearest mean. This mean acts as the prototype or centroid of the cluster.
- The algorithm works by minimizing the variance within each cluster. It ensures that points in the same group are as similar as possible. Points in different groups are as dissimilar as possible.
- The number K is a hyperparameter you must choose in advance. Selecting the right K is a crucial step for the algorithm's success.
How It Works
- The algorithm starts by randomly placing K centroids in the data space. Each centroid is the initial guess for a cluster's center. These starting points can be random data points or random locations.
- Next, it assigns every data point to its nearest centroid. Distance is usually measured using Euclidean distance. This forms the initial K clusters.
- Then, it recalculates the mean of all points in each cluster. These new means become the updated centroids. The assignment and update steps repeat until the centroids stabilize.
The Algorithm Steps
- Step 1: Initialize. Randomly select K data points as initial centroids. Step 2: Assignment. Assign each point to the closest centroid, forming clusters. Step 3: Update. Compute the new centroids as the mean of all points in each cluster.
- The algorithm iterates between Step 2 and Step 3 until convergence. Convergence occurs when assignments no longer change. The centroids have found stable positions.
- The formula for Euclidean distance between a point (x1, y1) and a centroid (c1, c2) is: Distance = sqrt( (x1 - c1)^2 + (y1 - c2)^2 )
A Practical Example
- Imagine we run an e-commerce store. We have data on customer spending and website visits. We want to group our customers to create targeted marketing campaigns.
- We will use two features: annual spending and average session duration. Each customer is a point on a 2D plot. K-Means will find groups based on these behaviors.
- We choose K=3 to find three distinct customer segments. The algorithm will process our data and assign each customer to a group.
Interpreting the Results
- After running K-Means, we get our three clusters. Cluster 1: Low spending, low engagement. These might be window shoppers or one-time buyers.
- Cluster 2: Medium spending, high engagement. These are our loyal enthusiasts who love browsing. They are prime candidates for loyalty programs.
- Cluster 3: High spending, medium engagement. These are our high-value, efficiency-driven customers. We can target them with premium product offers.
Choosing the Right K
- Selecting the correct number of clusters is vital. A common method is the Elbow Method. You run K-Means for a range of K values.
- For each K, calculate the Within-Cluster Sum of Squares (WCSS). WCSS measures the total variance within all clusters. You want low WCSS, meaning tight clusters.
- Plot WCSS against the number of clusters K. Look for an "elbow" where the rate of decrease sharply changes. This point often suggests a good value for K.
Why It Matters
- K-Means is powerful because of its simplicity and efficiency. It is easy to understand, implement, and scales to large datasets. It provides actionable insights quickly.
- Remember its limitations. It requires you to specify K and is sensitive to initial centroids. It also assumes clusters are spherical and of similar size.
- Despite this, it remains a cornerstone of unsupervised learning. Use it to explore your data and uncover hidden structures you didn't know existed.
Previous Resource
Is Your Report Slowing You Down
Next Resource K-Nearest Neighbors - Learning by Proximity
Client Service
Want custom technical carousels like this?
Through CaaS (Carousel as a Service), I research, write, and design high-retention 4:5 LinkedIn slide decks and PDFs for creators, founders, and tech teams.