Back to Home
Machine Learning 10 Slides
Linear Regression Explained Simply With Real Estate.
Use ← and → to navigate
Swipe left / right on mobile
Guide Notes & Explanation
Accompanying breakdown for this slide deck
- Linear Regression Explained Simply With Real Estate
What Is Linear Regression?
- Linear regression is a fundamental statistical method. It models the relationship between a dependent variable and one or more independent variables. The goal is to find a straight line that best fits the data points.
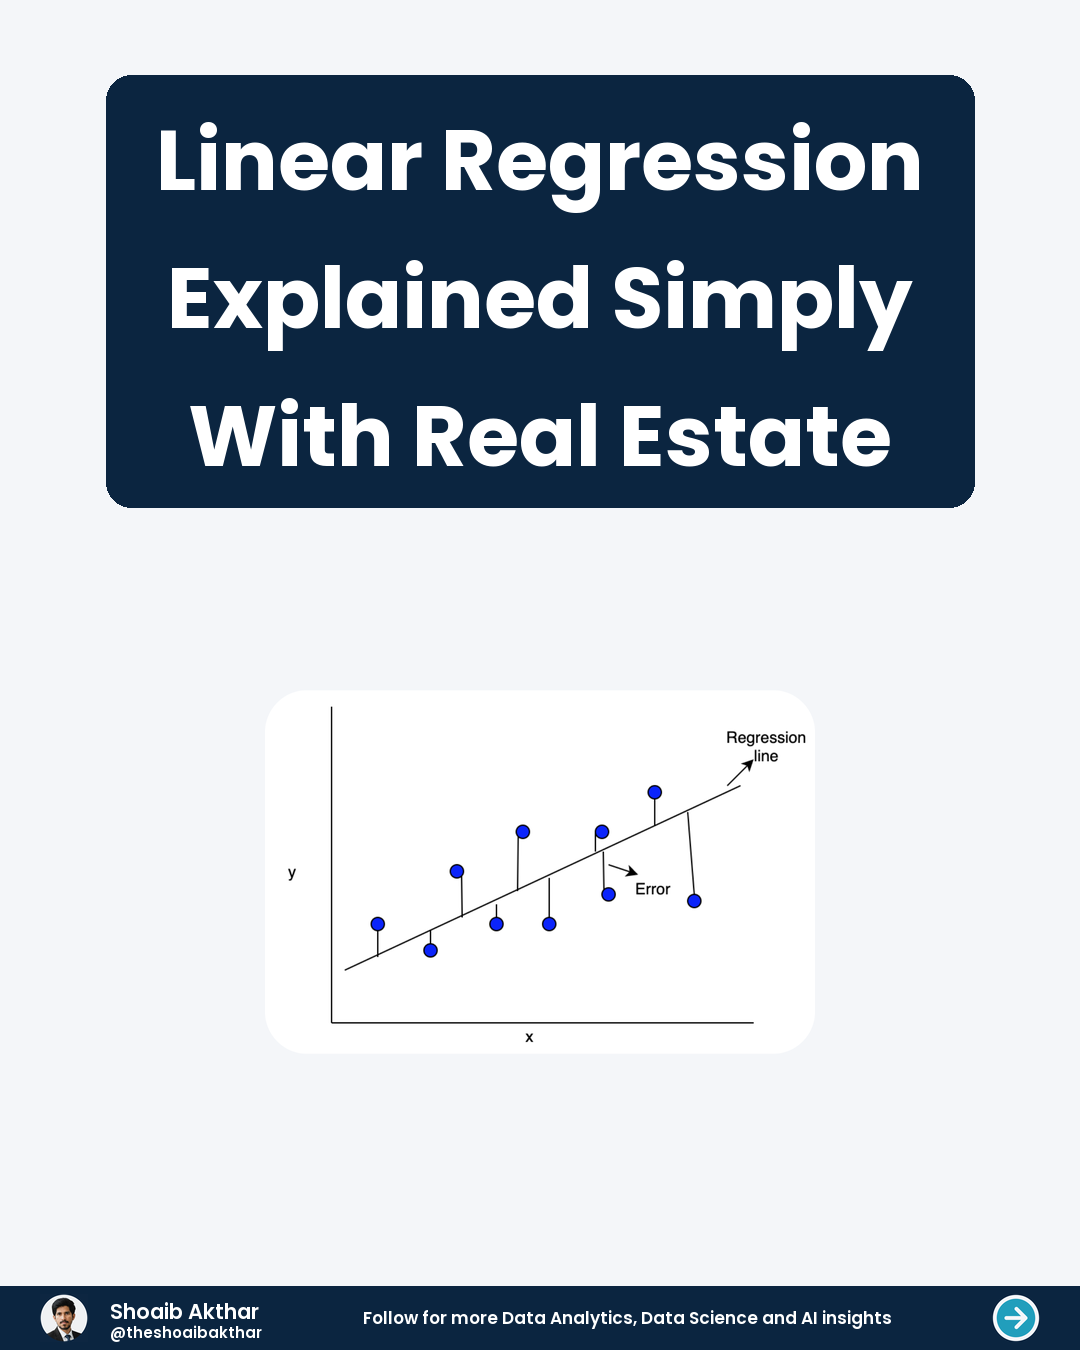
- Think of it as finding the best-fit line through a scatterplot of data. This line can then be used to make predictions. For example, it can predict house prices based on their size.
- It is powerful because it provides a simple and interpretable way to understand data trends. It's the starting point for many more complex machine learning models.
Our Real-World Example
- Let's use a clear example everyone can understand: predicting house prices. Our dependent variable, what we want to predict, is the price of a house.
- Our independent variable, the factor we use for prediction, will be the size of the house in square feet. We assume that, generally, larger houses cost more money.
- We will collect data on recent house sales in a specific area. This data set will include the size and the final sale price for each home.
The Data We Collect
- We start by gathering our data. Imagine we have information on five houses that recently sold.
- The data shows sizes and prices: 1000 sqft for $200,000, 1500 sqft for $250,000, 2000 sqft for $300,000, 2500 sqft for $350,000, and 3000 sqft for $400,000.
- We can plot this data on a graph. The size goes on the x-axis and the price on the y-axis. Each house is a single point on this scatter plot.
- We can already see a pattern. The points roughly form a straight line going upwards.
The Equation Of The Line
- The goal is to draw the best straight line through these points. This line is represented by a simple equation.
- The equation for a straight line is often written as: y = mx + b
- In the context of our linear regression model, we rewrite this as: Price = (Slope * Size) + Intercept
- Our task is to find the perfect values for the Slope and the Intercept. These values will define our best-fit line.
Finding The Best Fit
- How do we find the best values for Slope and Intercept? We use a method called Ordinary Least Squares (OLS).
- The method finds the line that minimizes the total error. The error is the distance between each data point and the line itself.
- The computer calculates this automatically. For our example data, the best-fit line might have a Slope of 100 and an Intercept of 100,000.
- So our model's equation becomes: Price = (100 * Size) + 100,000
Making A Prediction
- Now we can use our model to predict the price of a new house. Suppose a new house is listed with a size of 2200 square feet.
- We plug this size into our linear regression equation. Predicted Price = (100 * 2200) + 100,000
- Let's do the math. 100 * 2200 = 220,000 220,000 + 100,000 = 320,000
- Therefore, we predict the house will be priced at approximately $320,000.
It's Not Perfect
- It is crucial to remember that this is a prediction, not a guarantee. The real price might be different. Our model is a simplification of reality.
- Many other factors affect house prices, like location, age, and number of bedrooms. Our model only used size, so it ignores these other important variables.
- The difference between the predicted price and the actual price is called the residual. A good model has small residuals.
Why It Matters
- Linear regression helps us quantify relationships. We can say "for every extra square foot, the price increases by $100 on average."
- Businesses use it everywhere: forecasting sales, understanding customer behavior, and optimizing processes. It provides a data-driven foundation for decision-making.
- It is a accessible entry point into the world of machine learning. Mastering linear regression gives you a strong foundation for more advanced techniques.
Previous Resource
Level Up Your Models Feature Engineering Power
Next Resource Logistic Regression It's Not What You Think
Client Service
Want custom technical carousels like this?
Through CaaS (Carousel as a Service), I research, write, and design high-retention 4:5 LinkedIn slide decks and PDFs for creators, founders, and tech teams.