Use ← and → to navigate
Swipe left / right on mobile
Guide Notes & Explanation
Accompanying breakdown for this slide deck
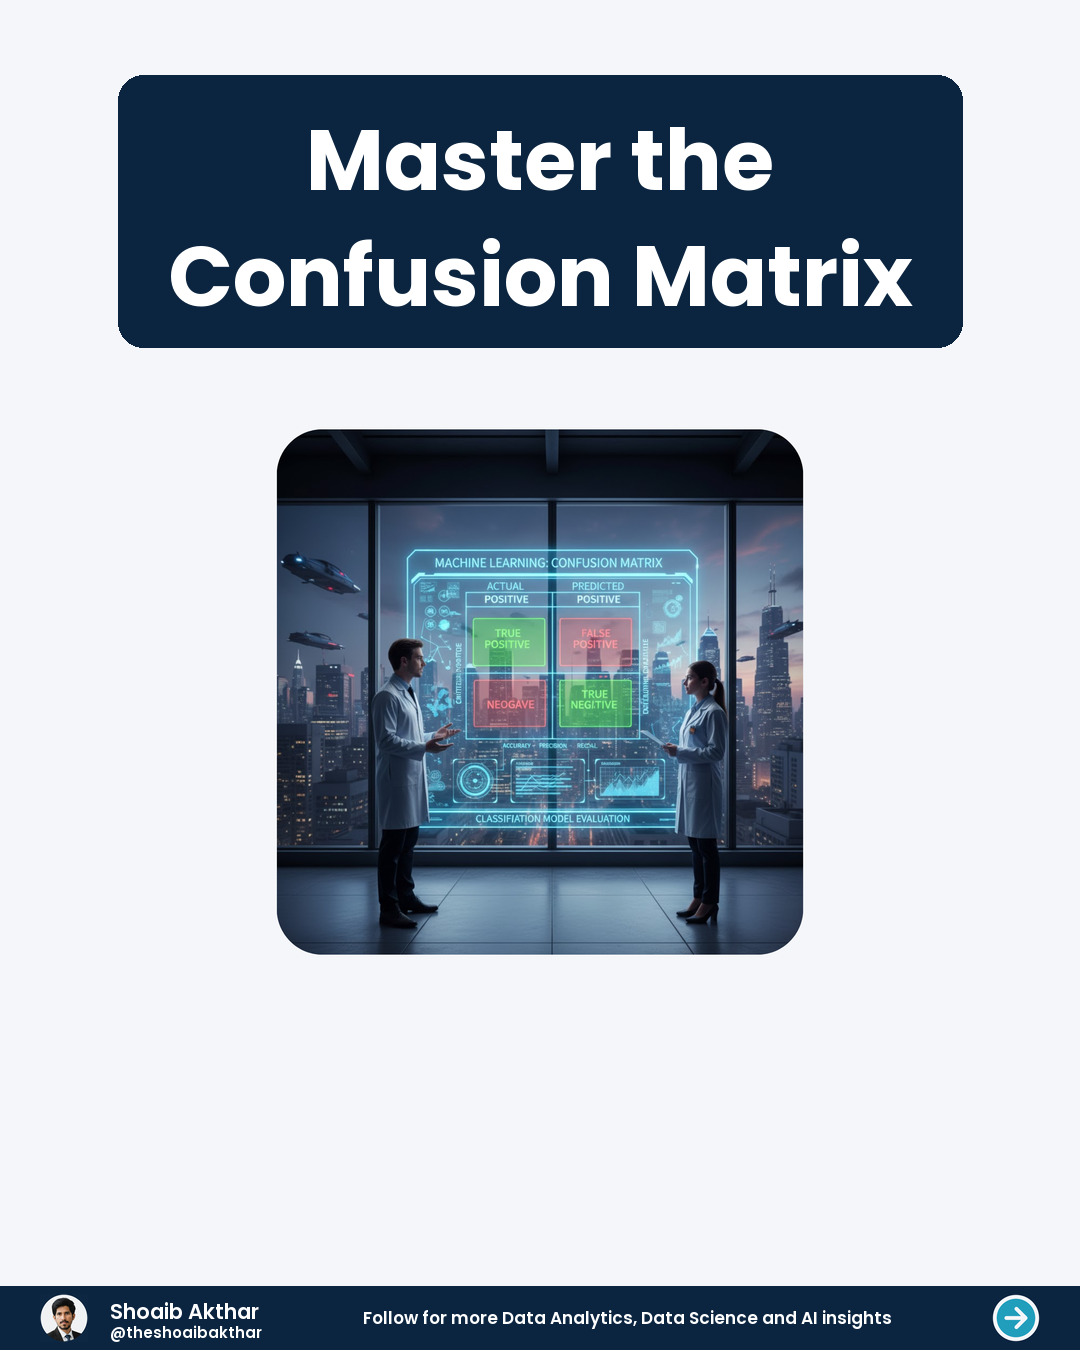
- Master the Confusion Matrix
What is a Confusion Matrix?
- A confusion matrix is a table that helps evaluate the performance of a classification model. It shows how often predictions match actual outcomes. Think of it as a scorecard for your model's accuracy.
- The matrix has rows for actual classes and columns for predicted classes. Each cell shows the count of predictions for that combination. It's a simple way to visualize model performance.
Basic Structure Explained
- The confusion matrix has four main components for binary classification. True Positives (TP) are correct positive predictions. True Negatives (TN) are correct negative predictions.
- False Positives (FP) are incorrect positive predictions. False Negatives (FN) are incorrect negative predictions. These terms help assess model accuracy and errors.
True Positives and Negatives
- True Positives occur when the model correctly predicts the positive class. True Negatives occur when the model correctly predicts the negative class. Both are desired outcomes.
- TP and TN show how well the model identifies correct cases. High values indicate good performance. They are essential for evaluating model reliability.
False Positives and Negatives
- False Positives occur when the model predicts positive but it's actually negative. False Negatives occur when the model predicts negative but it's actually positive. Both are errors.
- FP and FN highlight where the model makes mistakes. Understanding these helps improve model accuracy. They are crucial for diagnosing model weaknesses.
Key Metrics Derived
- Accuracy is the ratio of correct predictions (TP + TN) to total predictions. Precision is the ratio of TP to all predicted positives (TP + FP). Recall is the ratio of TP to all actual positives (TP + FN).
- F1 Score combines precision and recall into one metric. These metrics help assess model performance. They provide insights beyond raw counts.
Why Use a Confusion Matrix?
- It provides a clear view of model performance. It helps identify types of errors the model makes. It's essential for diagnosing and improving models.
- The matrix is simple yet powerful. It's used in various fields like healthcare and finance. It's a fundamental tool in machine learning.
Example Scenario
- Imagine a spam detector model. TP are correctly identified spam emails. TN are correctly identified non-spam emails. FP are non-spam emails marked as spam.
- FN are spam emails missed by the model. This example shows how the matrix works. It helps understand model behavior in real-world tasks.
Final Takeaways
- The confusion matrix is a simple yet powerful tool. It helps evaluate and improve classification models. Understanding it is crucial for data scientists.
- Use it to diagnose model errors and track improvements. Mastering the confusion matrix enhances your machine learning skills.
Previous Resource
Markov Decisions, Powerful RL Tools
Next Resource Master Your Data With These 5 Essential Charts
Client Service
Want custom technical carousels like this?
Through CaaS (Carousel as a Service), I research, write, and design high-retention 4:5 LinkedIn slide decks and PDFs for creators, founders, and tech teams.