Use ← and → to navigate
Swipe left / right on mobile
Guide Notes & Explanation
Accompanying breakdown for this slide deck
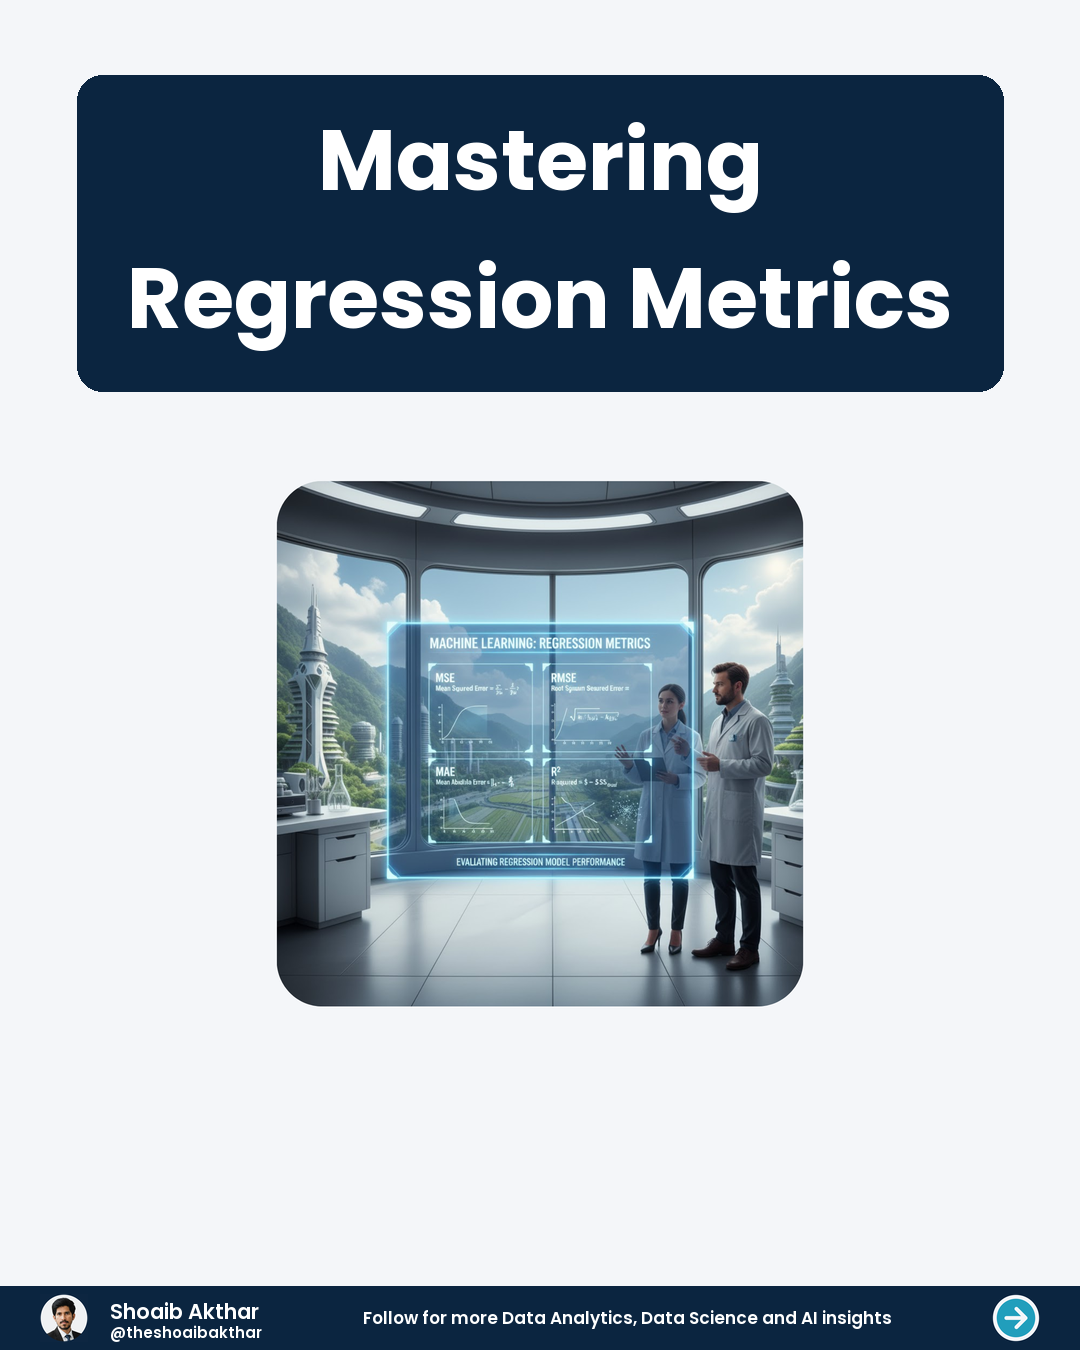
- Mastering Regression Metrics
What is MSE?
- Mean Squared Error (MSE) measures the average squared difference between predicted and actual values. It gives higher weight to larger errors due to squaring. Lower MSE indicates better model performance.
- MSE is sensitive to outliers because squaring large errors amplifies their impact. It's always non-negative and in the same units as the target variable squared. This metric is widely used in machine learning for regression tasks.
- To calculate MSE, subtract each actual value from the predicted value, square the result, and average these squared errors. The formula is:
- MSE = (1/n) * Σ (y_i - ŷ_i)^2
Understanding RMSE
- Root Mean Squared Error (RMSE) is the square root of MSE. It converts the error back to the original units of the target variable. RMSE is easier to interpret than MSE.
- Like MSE, RMSE is sensitive to outliers but provides a more intuitive scale. Lower RMSE values indicate better model accuracy. It's commonly used in weather forecasting and financial modeling.
- The formula for RMSE is:
- RMSE = √(MSE) or √[(1/n) * Σ (y_i - ŷ_i)^2]
Exploring MAE
- Mean Absolute Error (MAE) measures the average absolute difference between predicted and actual values. It treats all errors equally, regardless of their direction. MAE is less sensitive to outliers than MSE or RMSE.
- MAE is easier to understand and interpret than squared error metrics. It's particularly useful when you want to avoid the influence of extreme values. The formula for MAE is:
- MAE = (1/n) * Σ |y_i - ŷ_i|
The R² Metric
- R-squared (R²) measures the proportion of variance in the dependent variable explained by the model. It ranges from 0 to 1, where higher values indicate better fit. R² is dimensionless and scale-invariant.
- An R² of 1 means the model explains all variability in the data, while 0 means it explains none. Negative R² indicates a poor fit. It's widely used in statistical modeling and regression analysis.
- The formula for R² is:
- R² = 1 - (SS_res / SS_tot)
MSE vs RMSE
- MSE and RMSE are closely related but differ in interpretation and scale. MSE is in squared units, while RMSE is in the original units. RMSE is often preferred for interpretability.
- Both metrics penalize larger errors more heavily due to squaring. The choice between them depends on the context and ease of interpretation. MSE is mathematically convenient for optimization.
MAE vs MSE
- MAE and MSE differ in how they treat errors. MAE gives equal weight to all errors, while MSE emphasizes larger errors. MAE is more robust to outliers but less sensitive to large errors.
- MAE is easier to understand and compute, making it popular in some applications. MSE is more commonly used in gradient descent optimization due to its differentiability. The choice depends on the data and problem context.
When to Use R²
- Use R² when you want to understand how well your model explains the variance in the data. It's particularly useful for comparing models with different complexities. R² is scale-invariant, making it useful for different datasets.
- R² can be misleading with non-linear relationships or when the model is overfitted. It's often reported alongside other metrics for a complete picture. Always consider the context when interpreting R² values.
Choosing the Right Metric
- Select the metric based on your problem's requirements and data characteristics. Use MSE or RMSE when large errors are particularly costly. Choose MAE for robustness to outliers.
- Consider R² for understanding variance explanation and model comparison. Sometimes, using multiple metrics provides a more comprehensive evaluation. Always validate your choice with domain knowledge and experimentation.
Previous Resource
Mastering Hyperparameter Tuning
Next Resource Mix Data Modes Without Slowing Down Power BI
Client Service
Want custom technical carousels like this?
Through CaaS (Carousel as a Service), I research, write, and design high-retention 4:5 LinkedIn slide decks and PDFs for creators, founders, and tech teams.