Use ← and → to navigate
Swipe left / right on mobile
Guide Notes & Explanation
Accompanying breakdown for this slide deck
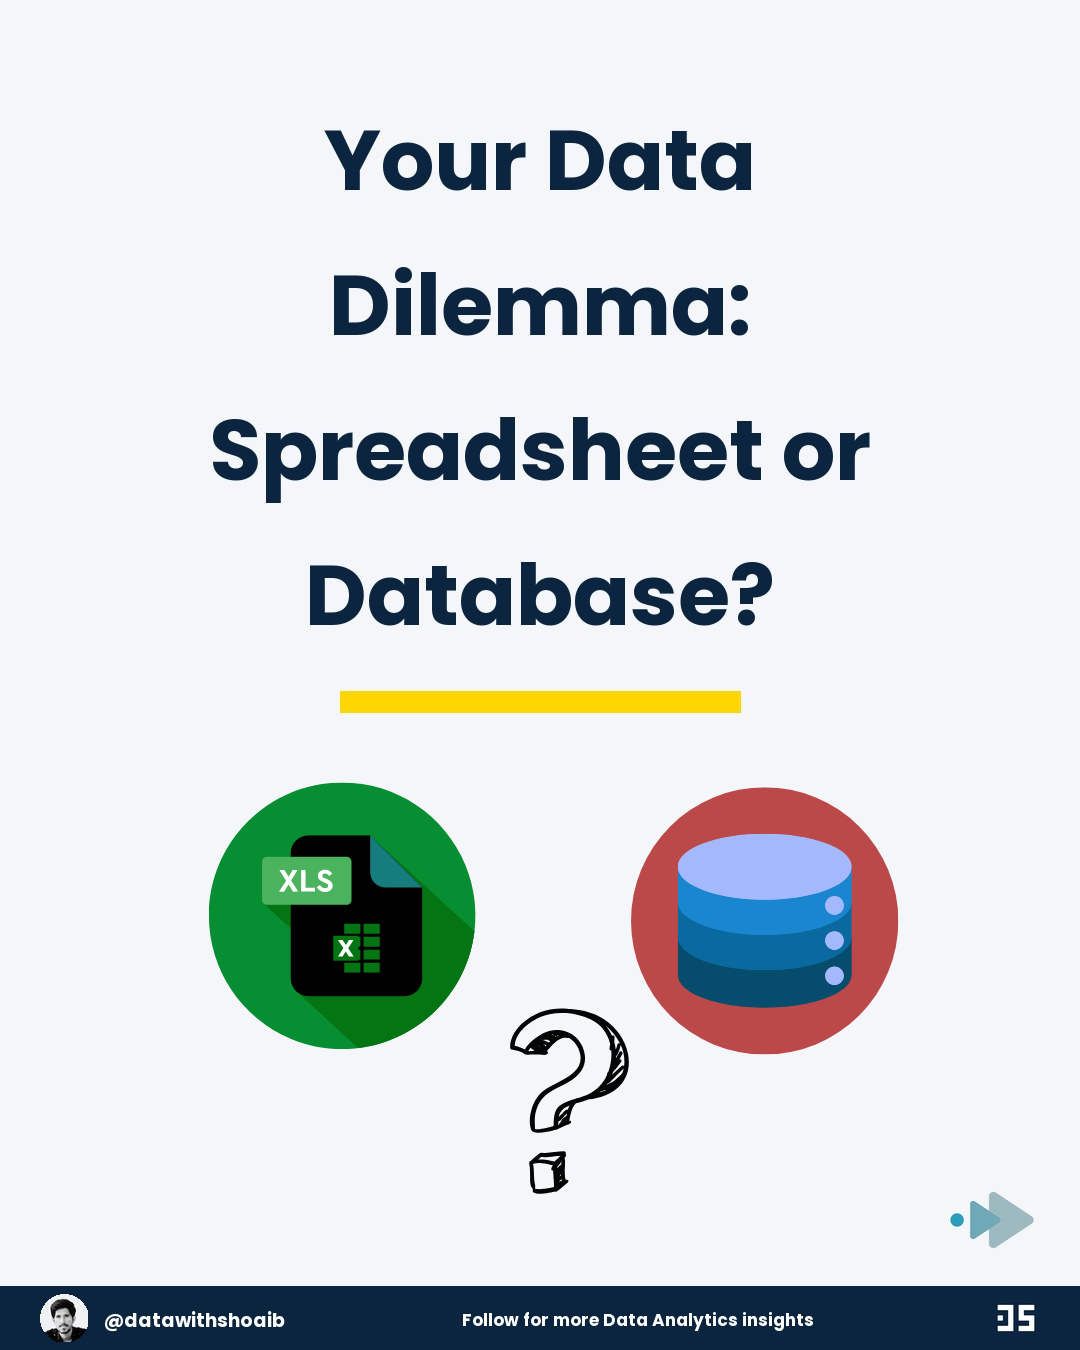
- Your Data Dilemma: Spreadsheet or Database?
What's The Difference?
- Excel is a spreadsheet application for analysis
- SQL is a language for querying databases
- Excel works best with single, flat files
- SQL is designed for relational data sets
- Excel is great for individual analysis
- SQL excels at managing large-scale data
- Think of Excel as a calculator, SQL as a data librarian
Use Excel When...
- Your dataset is small and manageable
- You need quick, ad-hoc calculations
- Creating charts and visualizations is your goal
- The analysis is for a one-time project
- You are working alone or sharing a simple file
- Performing manual data entry or cleaning
- Building a simple dashboard or report
Use SQL When...
- Your data is too large for Excel (100k+ rows)
- Data comes from multiple, connected sources
- You need to automate repetitive reporting
- Data integrity and security are critical
- Multiple people need to access the same data
- You are performing complex, multi-step analysis
- The data is constantly being updated
Data Size & Performance
- Excel can slow down or crash with big data
- SQL databases are built to handle millions of rows
- Excel has a row limit (around 1 million)
- SQL can process vast amounts of data quickly
- Filtering and sorting are faster in SQL
- Excel calculations can recalc slowly on large sets
- SQL queries pull only the data you request
Collaboration & Integrity
- Excel files can be easily overwritten or corrupted
- SQL databases allow for concurrent, safe access
- Tracking changes is difficult in shared Excel files
- SQL has built-in user permissions and roles
- Version control is a challenge with Excel
- SQL maintains a single source of truth
- Data validation rules are more robust in SQL
Automation & Repetition
- Excel requires manual refreshing of reports
- SQL queries can be automated and scheduled
- Pivot tables need manual adjustment for new data
- SQL ensures reports are always up-to-date
- Excel macros can be complex and fragile
- SQL pipelines reduce repetitive manual work
- Automating with Excel often leads to errors
Learning Curve
- Excel is generally easier to start with
- Basic SQL syntax can be learned quickly
- Advanced Excel formulas have a steep curve
- SQL skills are highly valued in the job market
- Most people have some familiarity with Excel
- SQL knowledge is a key data analytics skill
- Many free resources exist to learn both tools
They Work Together!
- Use SQL to query, process, and aggregate large data
- Export the smaller, final result set to Excel
- Build polished visualizations and charts in Excel
- Connect Excel directly to SQL databases for live data
- This combines the power of SQL with the presentation of Excel
- This is a very common and powerful workflow
- You don't always have to choose just one
Key Takeaway
- Not about which tool is "better"
- It's about using the right tool for the task
- Use Excel for small, visual, and quick tasks
- Use SQL for large, automated, and shared tasks
- Mastering both makes you a powerful analyst
- Your data needs will determine the best tool
- The goal is always efficient and accurate analysis
Your Next Steps
- Audit your current data tasks: are they slow or manual?
- For large datasets, explore a free SQL database like SQLite
- Practice basic SQL queries with online tutorials
- Learn to connect Excel to an external data source
- Start by using SQL to do the heavy lifting first
- Follow thought leaders in data analytics on LinkedIn
- Consistently practice with both tools to build skill
The Verdict?
- Start with Excel for simplicity and speed
- Graduate to SQL as your data grows
- The most effective analysts are bilingual
- Understand the strengths and weaknesses of each
- Your career will benefit from knowing both
- The best tool is the one that solves your problem
- Follow for more data tips
Previous Resource
Your Brain Learns Three Ways. So Do Machines
Next Resource Your Data is a Mess. Let SQL Fix It
Client Service
Want custom technical carousels like this?
Through CaaS (Carousel as a Service), I research, write, and design high-retention 4:5 LinkedIn slide decks and PDFs for creators, founders, and tech teams.