Use ← and → to navigate
Swipe left / right on mobile
Guide Notes & Explanation
Accompanying breakdown for this slide deck
- PCA: Unlocking Hidden Patterns in Your Data
What is PCA?
- PCA is a data reduction technique.
- It transforms high-dimensional data into a lower-dimensional space.
- This simplifies your data and makes it easier to visualize.
- It identifies the most important components of your data.
- It helps to remove noise and redundancy.
Why Use PCA?
- Reduces data size: Think smaller datasets.
- Improves model performance: Often leads to better algorithms.
- Easier visualization: Allows you to see relationships clearly.
- Faster computation: Fewer dimensions mean faster processing.
- Better feature selection: Highlights the most relevant variables.
How PCA Works
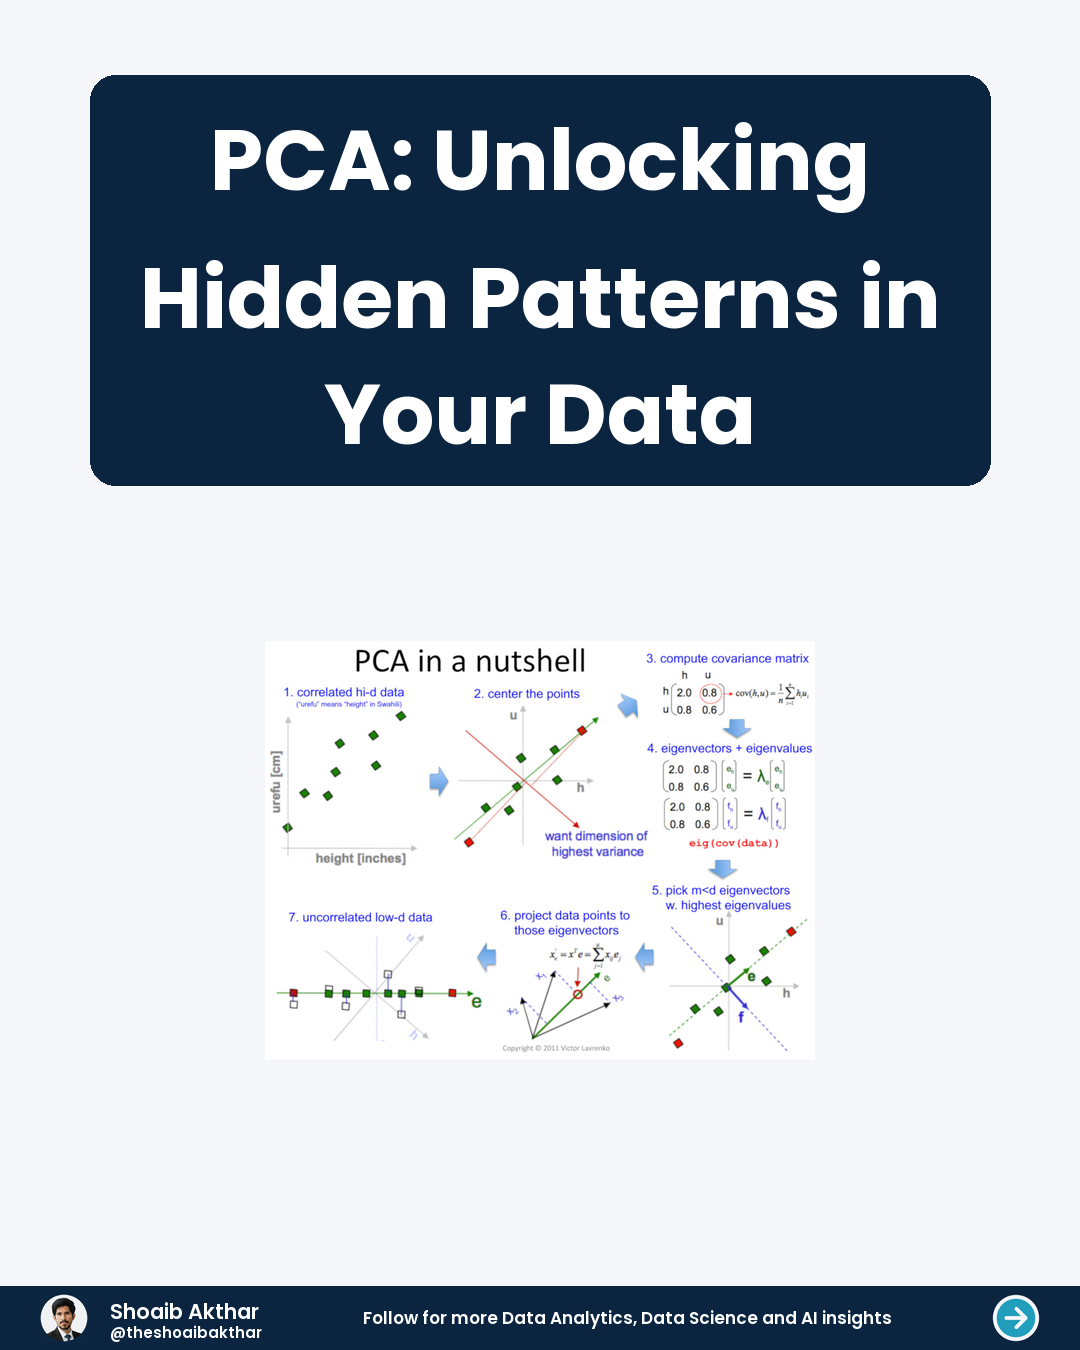
- PCA identifies the primary axes of variation.
- Each axis represents a principal component.
- The components are ordered by how much variance they explain.
- You can select a subset of components to reduce dimensionality.
- The goal is to retain most of the important information.
Variance Explained
- Variance describes how much data varies along an axis.
- Higher variance means a component is more important.
- The explained variance ratio tells you how much of the total variance is captured by each component.
- Aim for components with high explained variance.
- This ensures you're not discarding important information.
Example Scenario
- Imagine analyzing customer data with many features.
- PCA can reduce this to just a few key factors.
- This makes it easier to identify customer segments.
- These segments reveal valuable purchasing patterns.
- It can improve marketing campaign targeting.
Choosing the Right Components
- You can retain all components, or select a subset.
- The number of components depends on your data and goals.
- Consider the explained variance ratio for each component.
- Use domain knowledge to guide your component selection.
- Experiment with different numbers of components.
Common Applications
- Image compression: Reduces file size without significant quality loss.
- Financial modeling: Simplifies complex financial data.
- Gene expression analysis: Identifies key genes in biological studies.
- Text analysis: Reduces dimensionality for natural language processing.
- Predictive analytics: Enhances accuracy of prediction models.
Limitations Exist
- PCA assumes linear relationships in data.
- It can be sensitive to outliers.
- It may not capture complex non-linear patterns.
- Scaling data properly is crucial for PCA to work effectively.
- Interpretability can be challenging with many components.
PCA to the Rescue
- PCA is a powerful tool for data simplification.
- It unlocks valuable insights from large datasets.
- Understand its principles and limitations.
- Experiment to find the optimal solution for your needs.
- Unlock the power of dimensionality reduction.
Previous Resource
Naive Bayes The Simple Genius of Text Classification
Next Resource Prevent Overfitting with Regularization
Client Service
Want custom technical carousels like this?
Through CaaS (Carousel as a Service), I research, write, and design high-retention 4:5 LinkedIn slide decks and PDFs for creators, founders, and tech teams.